RELATIVE RATING METHOD
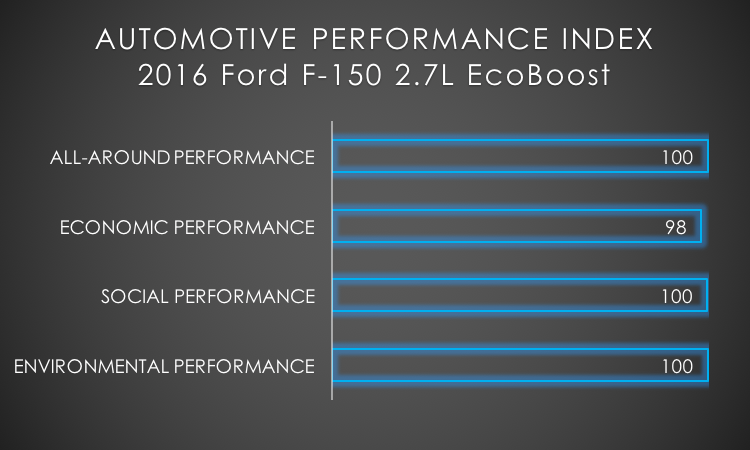
The Automotive Performance Index (API) applies statistical methods to demonstrate each vehicle rating in relative comparison. For example, the vehicle that performs highest in environment performance in a given class obtains a rating score of 100. Each vehicle in its class is then compared relative to the top-performing vehicle with a rating score reflecting the statistical difference in performance outcomes. A score of 91 translates to a 9% environmental performance deficit as compared to the top-performing vehicle.
Due to the API’s relative vehicle rating method, vehicle class divisions were identified as a critical input - these class divisions are detailed here.
While the Automotive Performance Index is indeed an exhaustive list of vehicles to trim level detail, with each vehicle assessment reporting over 200 unique data outputs (the culmination of thousands of data inputs), ASG has taken additional measures to ease the burden of sorting through all data points and all vehicle assessments. We have developed key performance categories and sorted all vehicles in each class according to Environmental Performance, Social Performance, Economic Performance and All-Around Performance. The vehicle in each class with the best score in each unique category is named the performance award winner (i.e. Best Environmental Performance Award winner). The vehicle in each class that scores highest combined scores in Environmental Performance, Social Performance and Economic Performance is named the ASG Best All-Around Performance Award winner.
One step further, we also name the Best 5 All-Around Performance Award winners in each class to provide consumers with a concise product comparison guide.


